Table of Contents
ToggleHave you ever wondered how businesses know exactly what their customers are doing on their websites? How do they track which pages you visit, how long you stay, and what you click on?
The answer lies in a powerful tool called Google Analytics. This tool has become a cornerstone for businesses of all sizes, helping them understand their audience, improve their website’s performance, and ultimately drive more sales.
How Google Analytics Impacts Businesses
In today’s digital age, data is king. Without understanding your website’s performance and your users’ behavior, you’re essentially flying blind.
Google Analytics provides the insights you need to make informed decisions, optimize your marketing strategies, and ensure your website is meeting your business goals.
Whether you’re running a small blog or a large e-commerce site, Google Analytics is an indispensable tool that can give you a competitive edge.
How Does Google Analytics Work?
The Role of Tracking Code
Google Analytics works by embedding a small piece of JavaScript code on your website. This code collects data from each visitor, including which pages they visit, how long they stay, and what actions they take. The tracking code is the heart of Google Analytics, enabling it to gather all the information you need to analyze your website’s performance.
Data Collection and Processing
Once the tracking code is installed, data starts flowing into your Google Analytics account. This data is then processed and categorized into different reports that you can view and analyze. Google Analytics organizes this data in a way that makes it easy for you to understand and act on it, whether you’re looking at real-time data or historical trends.
Key Terminology in Google Analytics
Users, Sessions, and Pageviews
Before diving into your Google Analytics reports, it’s essential to understand some key terms. “Users” refers to the individual visitors to your site. A “session” is a group of interactions that a user takes within a given time frame, and “pageviews” are the total number of pages viewed.
Bounce Rate and Exit Rate
The bounce rate is the percentage of visitors who leave your site after viewing only one page. A high bounce rate can indicate that your landing page isn’t engaging enough. The exit rate, on the other hand, shows the percentage of users who leave from a specific page after having visited other pages on your site.
Conversion Rate and Goals
Conversion rate is one of the most critical metrics in Google Analytics. It represents the percentage of users who complete a desired action, such as making a purchase or signing up for a newsletter. Goals in Google Analytics are specific actions that you define as valuable, and tracking these goals helps you measure your website’s success.
Setting Up Google Analytics
Getting Started with Google Analytics
Creating a Google Analytics Account
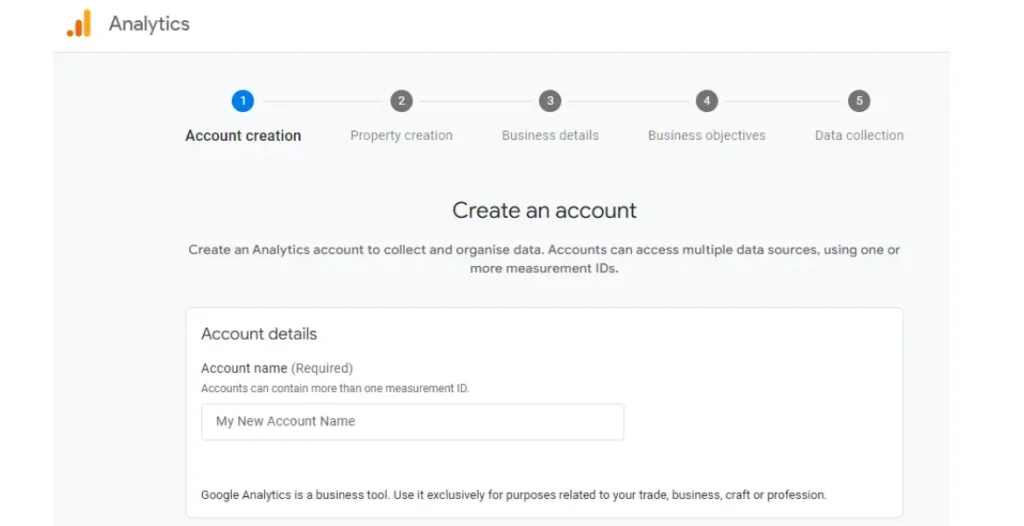
The first step to harnessing the power of Google Analytics is creating an account. You’ll need a Google account to get started. Once you’ve signed up, you can create a property for your website, which will serve as the container for all your data.

Installing the Tracking Code
After creating your account, the next step is to install the tracking code on your website. This code should be placed on every page of your site to ensure comprehensive data collection. If you’re using a content management system (CMS) like WordPress, there are plugins available that make this process easier.
Configuring Your Google Analytics Account
Setting Up Views and Filters
Views in Google Analytics allow you to create different perspectives of your data. For example, you might want to create one view that excludes internal traffic and another that includes all data. Filters can help you refine your data further, removing any noise that might distort your analysis.
Defining Goals and Events
Goals are essential for tracking conversions. You can set up goals based on specific actions you want your users to take, like completing a purchase or signing up for a newsletter. Events, on the other hand, track specific interactions, such as button clicks or video plays, giving you a more granular view of user behavior.
Navigating the Google Analytics Dashboard
Overview of the Google Analytics Interface
The Home Tab
The Home tab is the first thing you’ll see when you log in to Google Analytics. It provides a high-level overview of your website’s performance, including metrics like the number of users, sessions, and bounce rate. This is your go-to place for a quick snapshot of how your site is doing.
Real-Time Reports
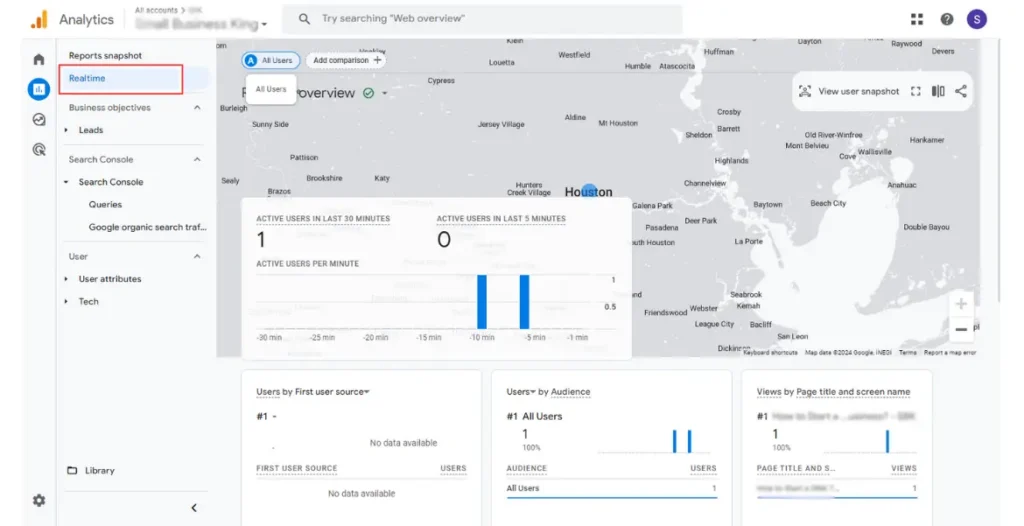
Real-time reports are one of the most exciting features of Google Analytics. They allow you to see what’s happening on your site as it happens. Whether you’re launching a new campaign or monitoring site performance during a peak traffic period, real-time data can be incredibly valuable.

Understanding Reports in Google Analytics
Audience Reports
Audience reports give you insights into who your users are. You can learn about their demographics, interests, and behaviors. This information is crucial for tailoring your content and marketing strategies to better meet the needs of your target audience.
Acquisition Reports
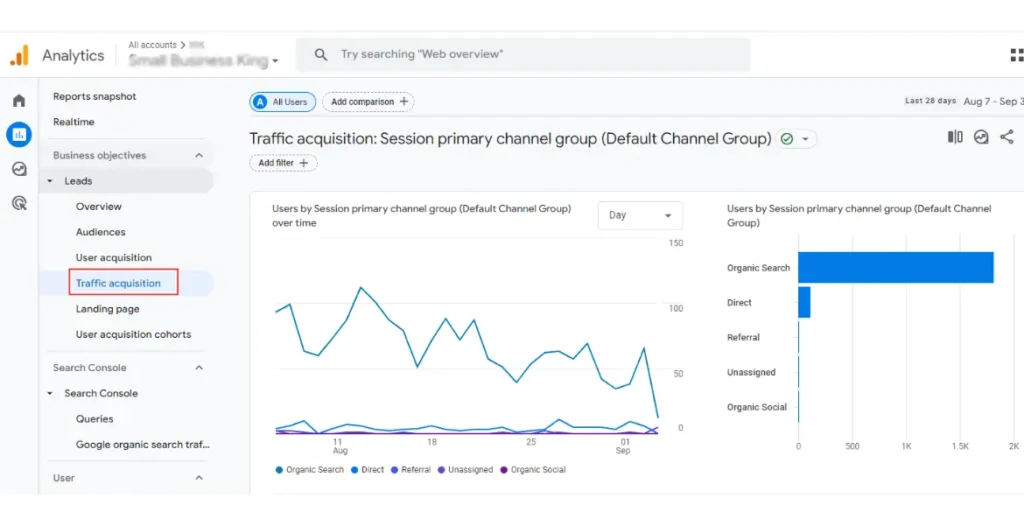
Acquisition reports show you how users are finding your website. Are they coming from search engines, social media, or direct traffic? Understanding your acquisition channels helps you allocate your marketing budget more effectively.
Behavior Reports
Behavior reports provide details on how users interact with your site. You can see which pages are the most popular, how users navigate through your site, and what content is resonating with your audience. This information is vital for optimizing your site’s user experience.
Conversion Reports
Conversion reports are where the magic happens. These reports show you how well your site is converting visitors into customers. You can track specific goals, analyze e-commerce performance, and gain insights into the effectiveness of your sales funnel.
Optimized Reports Boost Conversion!
Get useful data from the reports that can help drive meaningful conversions and boost your campaign.
Advanced Features of Google Analytics
Using Segments in Google Analytics
What Are Segments?
Segments in Google Analytics allow you to break down your data into smaller, more manageable pieces. For example, you can create a segment to view data from mobile users only or from users who have completed a specific goal.
Similarly, you may have subdomains that you want to track separately. Segments help you analyze your data more effectively.
Creating and Analyzing Segments
Creating segments is easy and can be done directly within the Google Analytics interface. Once you’ve created a segment, you can apply it to any report to gain deeper insights. Analyzing segments helps you understand different user behaviors and tailor your strategies accordingly.
Leveraging Custom Reports
How to Create Custom Reports
Custom reports allow you to tailor your Google Analytics data to meet your specific needs. You can choose which metrics and dimensions to include, and even set up filters to refine the data further. Custom reports are a powerful way to focus on the data that matters most to your business.
Benefits of Custom Reporting
The primary benefit of custom reports is that they save you time. Instead of sifting through multiple standard reports, you can create a single report that contains all the information you need. This streamlined approach makes it easier to analyze your data and make informed decisions.
Integrating Google Analytics with Other Tools
Google Ads Integration
Integrating Google Analytics with Google Ads allows you to track the performance of your ad campaigns more effectively. You can see how your ads are driving traffic to your site, which keywords are performing best, and how well those visitors are converting.
Google Search Console Integration
Google Search Console is another tool that can be integrated with Google Analytics. This integration provides insights into how your site is performing in search engines. You can see which queries are driving traffic to your site and how your site ranks for those queries.
Practical Applications of Google Analytics
Tracking Website Performance
Monitoring Traffic and User Behavior
Google Analytics is a powerful tool for tracking your website’s performance. You can monitor traffic trends, user behavior, and site speed. By analyzing this data, you can identify areas for improvement and optimize your site for better performance.

Analyzing Content Effectiveness
One of the key benefits of Google Analytics is its ability to track how well your content is performing. You can see which pages are getting the most views, how long users are staying on each page, and which pages are leading to conversions. This information is invaluable for refining your content strategy.
Optimizing Marketing Campaigns
Measuring Campaign ROI
Google Analytics allows you to measure the return on investment (ROI) of your marketing campaigns. You can track how much traffic each campaign is driving, how well that traffic is converting, and which campaigns are delivering the best results.
Understanding Customer Journey
By analyzing the customer journey in Google Analytics, you can gain insights into how users interact with your site before making a purchase. This information can help you optimize your sales funnel and improve your conversion rates.
Common Mistakes and How to Avoid Them
Misinterpreting Data
One of the most common mistakes in Google Analytics is misinterpreting the data. It’s essential to understand what each metric represents and how it fits into the bigger picture. Making decisions based on incorrect interpretations can lead to poor results.
Ignoring Mobile Traffic
With more people accessing websites from mobile devices, it’s crucial not to overlook mobile traffic in your Google Analytics reports. Make sure your site is mobile-friendly and that you’re analyzing mobile data to optimize the user experience for all devices.
Failing to Set Up Goals
Another common mistake is failing to set up goals in Google Analytics. Without goals, it’s challenging to measure your site’s success accurately. Make sure you’re setting up and tracking goals to get the most out of your data.
Stuck With Some GA Issue?
We can help you out! Get accurate reporting on your site today.
Conclusion
Google Analytics is more than just a tool; it’s a game-changer for businesses looking to succeed online. By providing in-depth insights into your website’s performance and user behavior, it empowers you to make data-driven decisions that drive growth and success.
To get the most out of Google Analytics, it’s essential to understand the data, set up your account correctly, and use the insights to improve your website and marketing strategies continually.
If you are having trouble setting up Google Analytics, you can rely on Go SEO Monkey’s organic SEO services that cover the technical aspects of your website’s SEO, making sure you always stay ahead of the game.
FAQs
- What is the difference between sessions and pageviews?
Sessions represent a group of user interactions within a specific timeframe, while pageviews count each time a page is loaded on your site. - How often should I check my Google Analytics data?
It’s a good practice to check your Google Analytics data at least once a week to stay informed about your website’s performance. - Can Google Analytics track mobile app data?
Yes, Google Analytics can track mobile app data through the Firebase integration, which allows you to analyze app performance in detail. - How accurate is the data in Google Analytics?
While Google Analytics provides a robust and reliable data set, it’s essential to understand that it may not capture 100% of all activity due to factors like ad blockers and data sampling. - Is Google Analytics free to use?
Yes, Google Analytics offers a free version with comprehensive features, although there is also a premium version called Google Analytics 360 for enterprise-level needs.


