Table of Contents
ToggleGoogle Analytics 4 (GA4) is packed with powerful tools that let you track user behavior on your website or app. One of the key metrics it provides is “sessions.” Sessions offer a snapshot of user activity within a given time frame, allowing you to see how people are engaging with your site. But how do you find sessions in GA4? Let’s break it down.
Session Is in GA4
What Defines a Session in GA4?
In GA4, a session is defined as a period of time when a user is actively engaging with your website. Unlike the previous Universal Analytics, GA4 has a different way of defining sessions. For instance, a session doesn’t automatically reset at midnight or after 30 minutes of inactivity. Instead, sessions are more fluid, capturing user actions such as scrolling, clicks, and interactions with content.
Why Are Sessions Important for Analytics?
Sessions help you understand the volume of activity on your site, but they also provide more detailed insights. They tell you how long users are staying, what pages they’re interacting with, and how they’re navigating through your website. This data is crucial for making informed decisions about your website design, content strategy, and user experience.
Understand sessions in GA4 and boost your insights now!
Unlock the power of GA4 sessions with guidance from our pros!
How to Find Sessions in GA4?
Navigating the GA4 Interface
First, to find sessions in GA4, you’ll need to get comfortable with the interface. GA4 organizes data differently than Universal Analytics, but don’t worry—it’s easy once you get the hang of it.
Steps to Locate Session Data in GA4
To locate session data in Google Analytics 4 (GA4), follow these detailed steps:
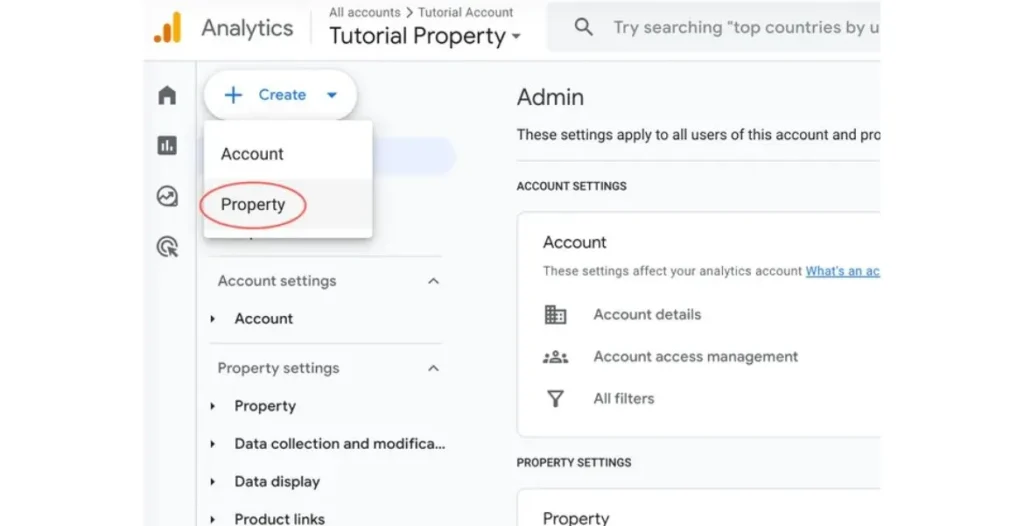
1. Log in to Your GA4 Account
- Access the Google Analytics platform by logging in and authenticate with your username and password.
- Ensure that you select the correct property from the account list where you want to view the session data.
2. Navigate to the 'Reports' Section
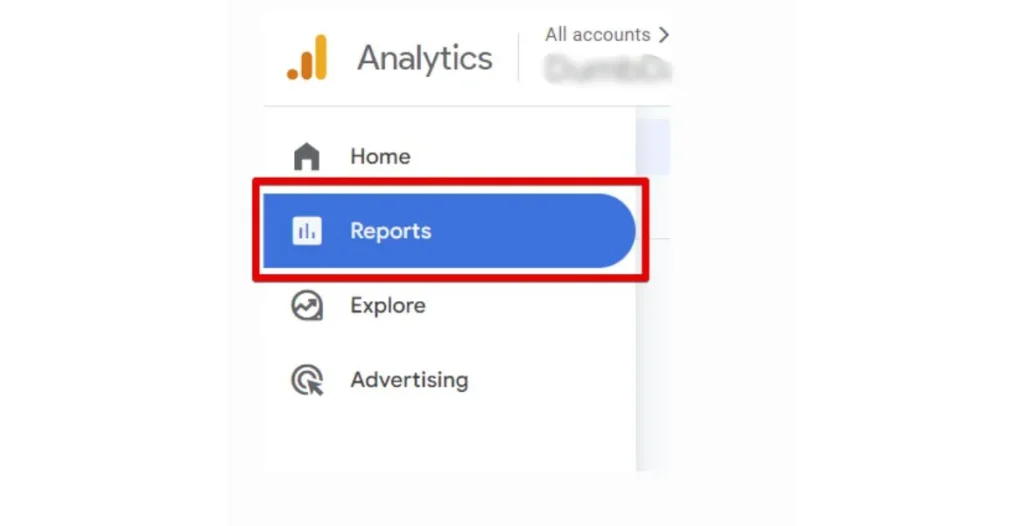
- After successful login, navigate to the left sidebar to access the menu of the dashboard.
- Click on the ‘Reports’ tab. This is where all the reporting tools are housed.
3. Access the ‘Life Cycle’ Reports
- You will find several reporting categories in the reports section.
- Locate the ‘Life Cycle’ section, which contains key reports related to the user journey.

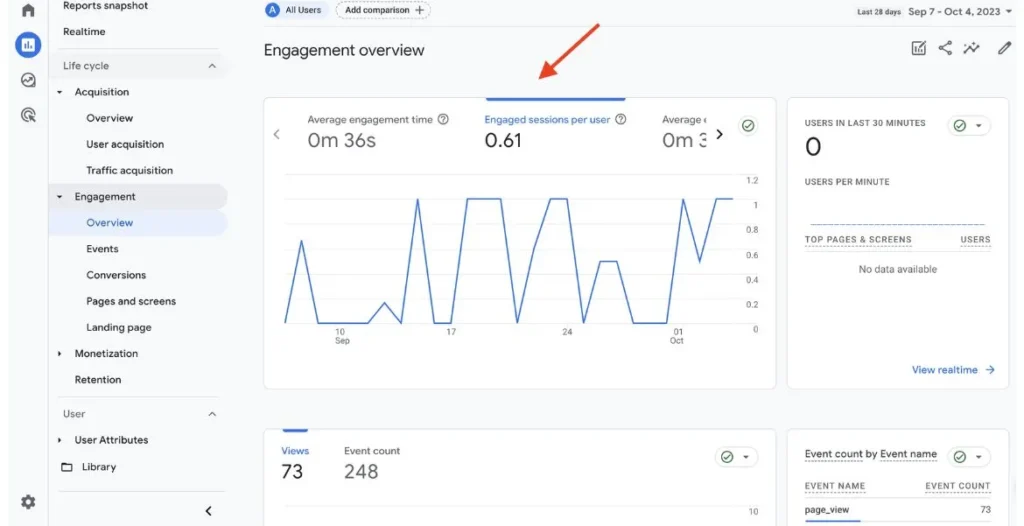
4. Go to ‘Engagement’
- Within the Life Cycle reports, click on ‘Engagement’.
- The Engagement section will display the reports on how users are engaging with your website or app.
5. View Session Data
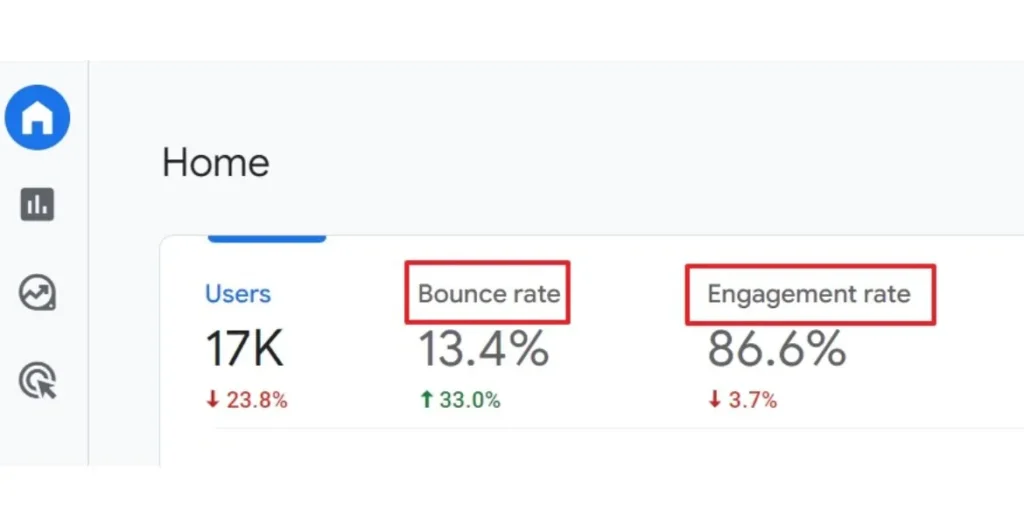
- In the Engagement section, you’ll find metrics like ‘Sessions’.
- This data provides an overview of the number of sessions, which reflect how users are engaging with your site over specific time periods.
- A session is a group of user interactions with your website within a given time frame (usually 30 minutes of inactivity).
Overview of Sessions Metric
- Sessions refer to individual visits where users engage with your site.
- This metric is important because it shows the total number of sessions (or visits) initiated by users during a set period, offering insight into user activity and engagement levels.
- You can view additional engagement metrics in this section, including average session duration and engagement rate.
This process helps you easily locate, view, and interpret user session data within GA4.
How can I View Average Session Duration in GA4?
Importance of Average Session Duration
The average session duration metric helps you determine how long users are staying on your site during a single session. A longer session generally means better engagement—unless it’s due to users being lost or confused!
Steps to View Average Session Duration
- In the ‘Engagement’ report, look for the metric labeled ‘Average session duration’.
- Click on it for a deeper dive into user engagement on your site.
Find out the steps to view average session time in GA4 now!
Let us guide you through analyzing average session duration in GA4 now!
How do I Find Pages Per Session in Google Analytics 4?
Why Pages Per Session Matters?
Pages per session tells you how many pages a user typically views in one session. It’s an excellent indicator of how engaging your content is and how easy it is to navigate between pages.
Steps to Locate Pages Per Session Metric
1. Log in to Your GA4 Account
- Open the Google Analytics website or app and sign in with your credentials.
- Ensure you’re viewing the correct property where you want to analyze the Pages Per Session metric.

2. Navigate to the 'Reports' Section
- Once you’re logged in, look for the left-hand side menu and click on the ‘Reports’ tab.
- This will bring up a set of reports related to user activity on your website or app.

3. Go to the ‘Engagement’ Section
- Inside the Reports section, you’ll find multiple reporting options.
- Click on the ‘Engagement’ category under the ‘Life Cycle’ reports. This section focuses on how users interact with your content.

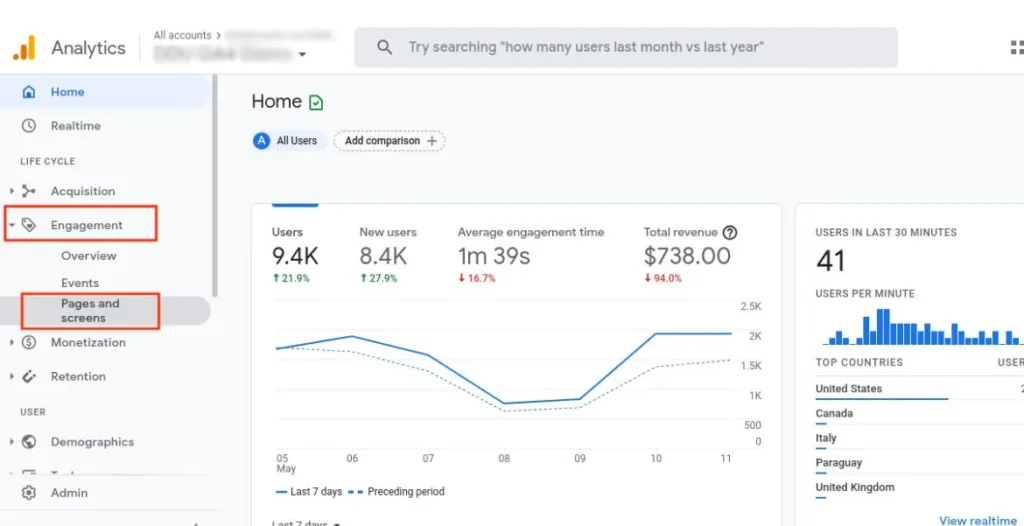
4. Access the ‘Pages and Screens’ Report
- Within the Engagement section, you’ll see various sub-sections.
- Click on ‘Pages and Screens’, which displays data about the specific pages users visit and how they engage with them.
5. Filter for the ‘Pages per Session’ Metric
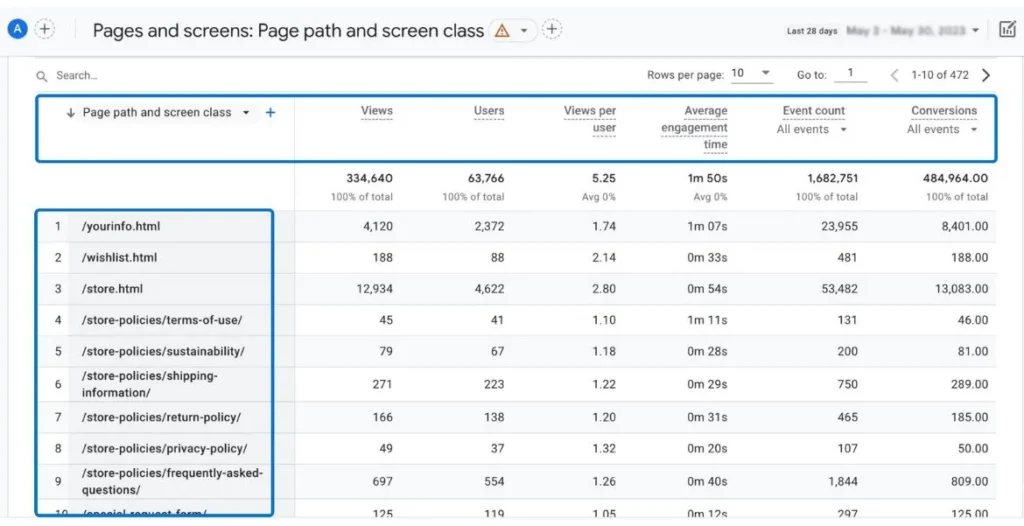
- In the ‘Pages and Screens’ report, you’ll see several metrics displayed.
- Use the filter or metrics tab to locate and select ‘Pages per session’.
- This metric shows you how many pages users are visiting during a single session on average.
6. Understand the 'Pages Per Session' Metric
- Pages per session averages user engagement across multiple pages.
- This helps you understand user engagement and content navigation. If users view more pages in a single session, it can indicate that they are exploring your website deeply.
- This metric is particularly useful for gauging the effectiveness of internal linking and user flow throughout your website.
Example of Key Insights:
- High Pages per Session: Indicates that users are highly engaged and navigating through multiple pages in one visit.
- Low Pages per Session: May suggest that users are not finding your content engaging or that your website layout or navigation is confusing.
By following these steps, you can quickly locate and analyze the Pages per Session metric in GA4 to improve your understanding of user behavior on your site.
Engaged Sessions vs. Total Sessions
Definition of Engaged Sessions in GA4
An engaged session is one where the user stays on your site for 10 seconds or more, views at least one page, or triggers a conversion event. GA4 places more emphasis on engagement rather than just passive page views.
How Engaged Sessions Differ from Total Sessions?
While total sessions capture every instance of user interaction, engaged sessions focus on meaningful activity. This will help you in assessing the quality of user engagement.
Session Metrics Comparison: Views vs. Sessions in GA4
How Views and Sessions Are Tracked?
Sessions and views may sound similar but represent different aspects of user behavior. A view is simply the loading of a page or screen, while a session encompasses all the actions taken by the user during a single visit.
Which Metric Should You Prioritize?
Both are important, but sessions give a broader picture of user activity, while views help you track content popularity. Use a collaborative approach to get the best understanding.
Events vs. Sessions: A Key Distinction in GA4
How GA4 Tracks Events Alongside Sessions?
GA4 is built around event-based tracking. Every interaction, whether it’s a button click or a page scroll, is treated as an event. Sessions are essentially a collection of these events, providing a bigger picture of user interaction.
Events vs. Sessions: How They Impact User Tracking
In GA4, events are more granular, while sessions are the overarching structure. Use events to indulge into specific user actions and sessions to understand the overall behavior of your clients.
Where to Find Session Data in GA4?
Locating Sessions in the Explorations Report
The Explorations section in GA4 gives you more flexibility for analyzing session data. You can build custom reports, set your metrics, and dive into session details based on user segments.
Viewing Sessions Data by User Segment
Use the user segment filter in your Exploration report to see session data segmented by new users, returning users, and engaged users.
Viewing Session Data Over Time
Setting Time Ranges for Session Analysis
GA4 lets you adjust the time range to analyze sessions. You can set custom time frames—daily, weekly, or monthly—to track session trends over time.
Comparing Sessions Over Different Time Periods
Remember to use the comparison feature to check how session data differs between two different time periods. This can help you understand seasonal trends, marketing campaign impacts, or site changes.
Gain insights on session data over time and improve decisions!
Let our experts show you session data trends for stronger insights!
Where to Find Pages Per Session in GA4?
How Pages Per Session Helps in Understanding User Behavior
Pages per session is a key metric to gauge how effectively your website engages visitors. If users are visiting many pages, it often means they’re finding your content useful or interesting.
Steps to View Pages Per Session in Detailed Reports
- Head to the ‘Engagement’ > ‘Pages and Screens’ report.
- In the filter, select ‘Pages per session’ to see how many pages users are viewing on average.
Optimizing Your GA4 Setup for Better Session Insights
Custom Reports to Track Session Data
To get more tailored insights, consider setting up custom reports. This allows you to focus on specific metrics like session duration, pages per session, or engaged sessions.
Using Custom Events to Understand Session Flow
Creating custom events in GA4 gives you deeper insights into how users progress through a session, from landing pages to conversions.
Discover pro GA4 tips for deeper session data – start here!
Get expert GA4 session insights that transform your analytics!
Conclusion
In GA4, sessions are a crucial metric for understanding user engagement and interaction. By knowing where to find session data, pages per session, and understanding engaged sessions, you’ll be able to gain deeper insights into your audience’s behavior. To fully harness GA4’s capabilities, consider setting up custom reports and leveraging session metrics to improve your website’s performance.
Need expert help? Go SEO Monkey specializes in optimizing GA4 setup for businesses to ensure you’re making the most out of your analytics data.
FAQs
- How do I compare sessions and pageviews in GA4?
Sessions track the entire user visit, while page views count individual page loads. You can compare them in the ‘Engagement’ report. - What’s the difference between sessions and events in GA4?
Sessions are broader, tracking all user activity in a visit, while events track specific actions like clicks or scrolls. - How do I track session duration in GA4?
Find this metric in the ‘Engagement’ > ‘Overview’ section under ‘Average session duration’. - What is an engaged session in GA4?
It’s a session where a user stays for up to 10 seconds or more, views at least one page, or boosts a conversion event. - How do I create a custom report to track sessions in GA4?
Use the Explorations tab to build a report focused on sessions by selecting session-related metrics.


