Table of Contents
ToggleGoogle Data Studio empowers data-driven decision-making, blending data from multiple sources into intuitive, shareable reports and dashboards. This tool is not just for data analysts; it’s accessible for marketers, business owners, and anyone who wants to glean insights from data.
Google Data Studio is a cloud-based reporting tool that allows users to create custom dashboards and visually appealing reports by connecting various data sources. Whether you’re monitoring website performance, tracking sales figures, or analyzing marketing campaigns, Data Studio provides a user-friendly interface for visualizing data without requiring advanced technical skills.
Google Data Studio Working
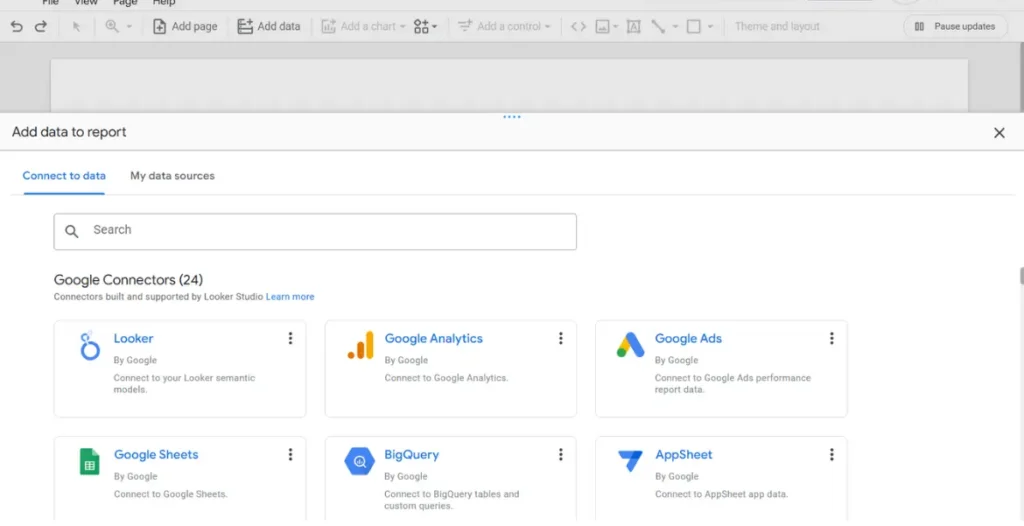
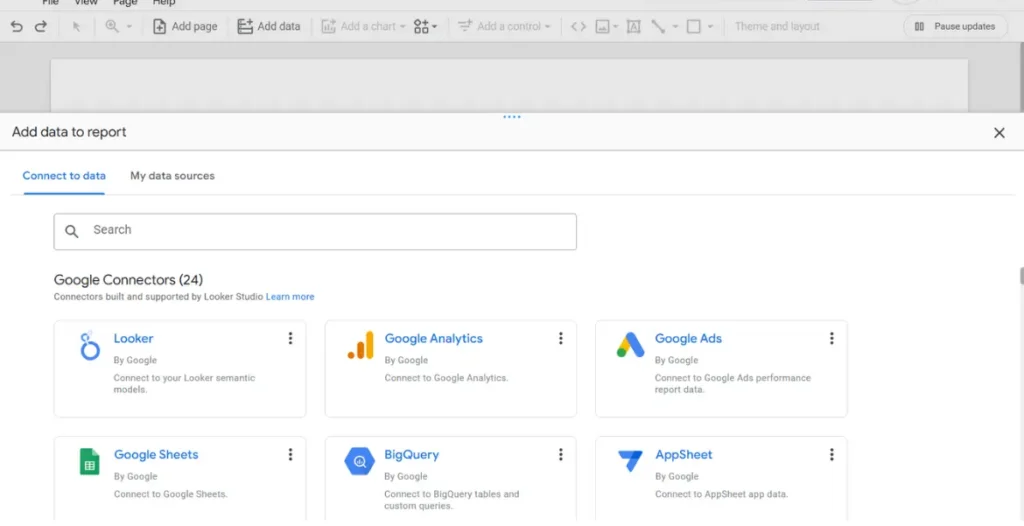
Google Data Studio synchronizes data from various platforms, enabling unified reporting and analysis. Users can connect to Google services such as Google Analytics, Google Ads, Google Sheets, and BigQuery, along with third-party applications and databases. Once the data is connected, users can select from a variety of visualization options—including charts, graphs, and tables—to create insightful reports that tell a story with their data.
Discover how Google Data Studio transforms your data today!
Let us guide you in using Google Data Studio for clear, actionable analytics!
Key Features of Google Data Studio
1. Customizable Dashboards
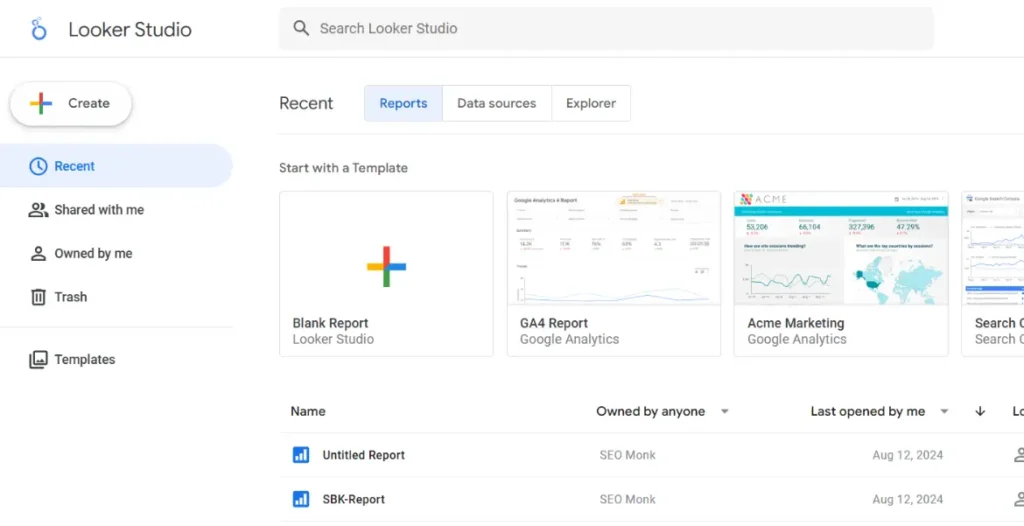
One of the standout features of Google Data Studio is its ability to create fully customizable dashboards. Users can design their reports from scratch or choose from a variety of templates that suit their needs. This flexibility allows businesses to highlight their most critical metrics in a way that resonates with their stakeholders.
2. Real-Time Data Reporting
Real-time reporting is crucial for making timely decisions. Google Data Studio provides up-to-the-minute data visualizations, allowing users to see how their performance metrics change throughout the day. This feature is particularly beneficial for businesses that rely on immediate feedback to adjust their strategies.
3. Interactive Dashboards
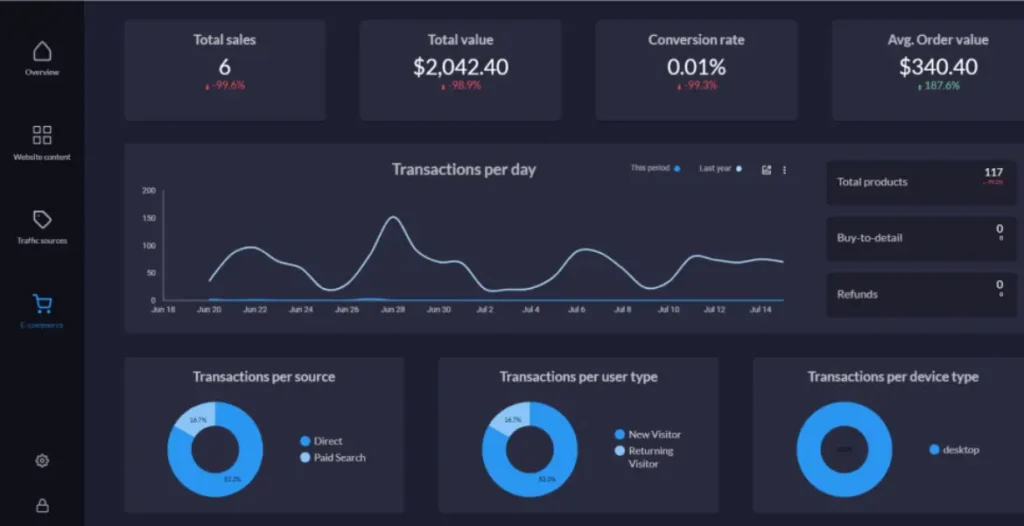
Google Data Studio revolutionizes the way we interact with data through its dynamic dashboards. Unlike traditional static reports, this tool empowers users to engage actively with their data. Viewers can filter specific datasets, focus on key metrics, and modify visual representations to explore various aspects of the information. This level of interactivity not only enhances user engagement but also promotes a better understanding of the underlying data trends and insights.
4. Simplified Sharing and Collaboration
The platform simplifies the process of distributing reports, allowing users to share their findings effortlessly with colleagues or clients. You can control access settings, offering either view-only permissions or editable rights based on the needs of your audience. This flexibility makes collaborative analysis straightforward and efficient, fostering an environment where feedback and discussion thrive.
Advantages of Utilizing Google Data Studio
1. Cost-Effective Solution
Google Data Studio provides a no-cost solution for data-driven insights, empowering informed decision-making. This aspect makes it an ideal choice for businesses of all sizes, especially smaller enterprises with budget constraints, as they can access advanced data visualization tools without any financial burden.
2. Seamless Integration with Google Ecosystem
For organizations already using Google products, Data Studio provides smooth integration with tools such as Google Analytics, Google Ads, and Google Sheets. This capability allows for efficient data consolidation and simplifies the process of analyzing performance metrics across multiple platforms.
3. Enhanced Data Understanding
The visual nature of reports created with Google Data Studio facilitates a deeper understanding of data trends. Stakeholders can quickly grasp key performance indicators, eliminating the need to sift through complex spreadsheets and allowing for faster, more informed decision-making.
How to Utilize Google Data Studio: A Step-by-Step Guide
Step 1: Sign Up and Access
Begin by creating an account with Google Data Studio using your Google credentials. Once logged in, navigate to the Data Studio homepage to start exploring its features.

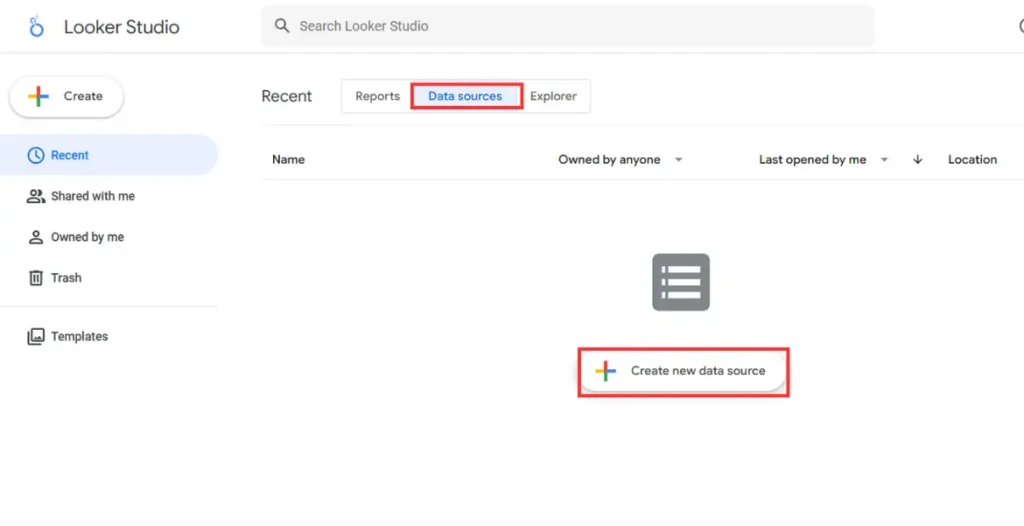
Step 2: Connect Data Sources
Choose your preferred data source connectors, such as Google Analytics or Google Search Console. This step enables you to import pertinent data for your reports, ensuring that you have all the necessary information at your fingertips.
Step 3: Create a New Report
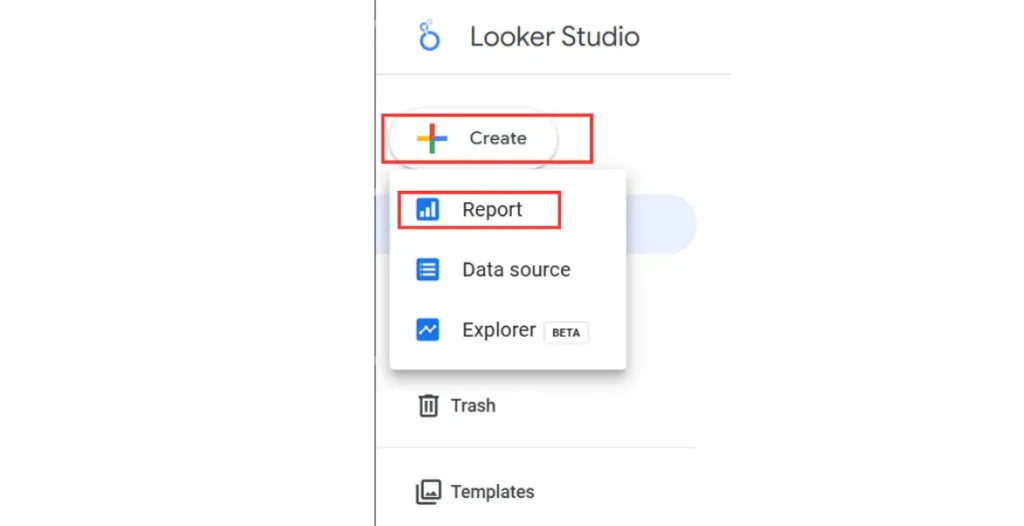
To start a new project, click the “Create” button and select “Report.” You can either build your report from the ground up or choose from various available templates in Google Data Studio.
Step 4: Customize Your Dashboard
Make use of the intuitive drag-and-drop functionality to incorporate different visual elements like charts, tables, and graphs. Tailor your Google Data Studio dashboard by focusing on the key metrics that are most relevant to your analysis.
Step 5: Add Interactive Features
Boost engagement by incorporating filters and controls into your dashboard. These features allow users to interact with the data, making the insights more accessible and tailored to their needs.
Step 6: Share Insights
Leverage the power of collaboration by sharing your reports with stakeholders in real-time. You can configure the sharing options to grant view-only permissions or allow collaborative editing, depending on your audience’s requirements.
Step 7: Analyze and Improve
Regularly review your reports and make necessary adjustments based on user feedback and evolving business needs. If you seek to optimize your dashboards further, consider reaching out to a Google Data Studio consultant for specialized guidance.
Using Google Data Studio streamlines the reporting process and empowers organizations to make data-driven decisions through dynamic and real-time insights, transforming raw data into meaningful narratives.
Creating a Google Data Studio Dashboard: A Step-by-Step Guide
Step 1:Connect Data Sources: Start by selecting the data sources you wish to incorporate into your report. With Data Studio, connect to diverse platforms and data sources using its robust and adaptable connector ecosystem.
Step 2:Choose a Template: You can either create a report from scratch or select from a range of pre-designed templates that suit your reporting needs.
Step 3:Add Visual Elements: Utilize the drag-and-drop feature to insert various visualizations into your report. Customize these elements to emphasize the metrics that matter most to your audience.
Step 4:Incorporate Filters: Enhance the interactivity of your report by adding filters, allowing users to segment the data based on specific criteria.
Step 5:Share and Collaborate: Once your report is complete, share it with relevant stakeholders. Google Data Studio streamlines multi-user collaboration, enabling simultaneous report edits and updates.
Illustrative Examples of Google Data Studio Dashboards
Many organizations leverage Google Data Studio to create dashboards for monitoring a range of activities, such as website performance, marketing campaigns, or sales metrics. For instance, a digital marketing firm might design a dashboard that visualizes Google Analytics data, showcasing traffic sources, conversion rates, and user engagement—all presented within a cohesive and user-friendly interface.
Best Practices for Google Data Studio
- Focus on Simplicity: Aim for clarity in your dashboard designs. Avoid overwhelming users with excessive information by concentrating on the key metrics that drive decision-making.
- Ensure Consistent Design: Use consistent design elements—such as colors, fonts, and layout—to enhance the professionalism of your reports and improve navigation for users.
- Regularly Refresh Data Connections: Keep your data connections up to date to reflect real-time changes, ensuring that your reports maintain accuracy and relevance.
- Gather User Feedback: Encourage stakeholders to share their thoughts on your dashboards. Understanding what data is most valuable to them can guide improvements and future reporting efforts.
Master Google Data Studio for effective data visualization!
Our experts turn Google Data Studio into your key to smarter decisions!
Conclusion
Google Data Studio is a powerful, cost-free resource that democratizes data visualization for businesses of all types. With its intuitive design and robust integration capabilities, it serves as an essential tool for those looking to enhance their data storytelling. By effectively utilizing Google Data Studio, organizations can uncover actionable insights and make data-driven decisions that propel their business forward.
If you’re eager to transform your data into meaningful insights, Go Seo Monkey offers an excellent entry point. Its adaptability and accessibility enable you to create reports that not only inform but also drive your strategic initiatives.
FAQs
- Is Google Data Studio free to use?
Yes, Google Data Studio is entirely free, with no hidden costs. - Can I connect Data Studio with services outside of Google?
Definitely! Data Studio’s flexible architecture allows seamless integration with third-party data sources for unified analytics. - Is Google Data Studio suitable for beginners?
Absolutely! The platform is designed to be user-friendly, featuring drag-and-drop functionalities that make it accessible for users at all skill levels. - What data formats does Google Data Studio support for visualization?
You can visualize many data types, including website analytics, sales figures, social media metrics, and more. - 5.Can multiple users edit a report simultaneously in Data Studio?
Yes, Google Data Studio supports multi-user report-building, allowing many users to contribute simultaneously.


