Table of Contents
ToggleGoogle Analytics 4 (GA4) is packed with powerful tools for analyzing user behavior, with Debug View being one of the essential features for real-time event tracking and debugging. If you’ve encountered issues or found that your Debug View in GA4 isn’t working, this guide provides the complete steps to enable it effectively, troubleshoot common problems, and maximize your debugging experience.
What is Debug View in GA4?
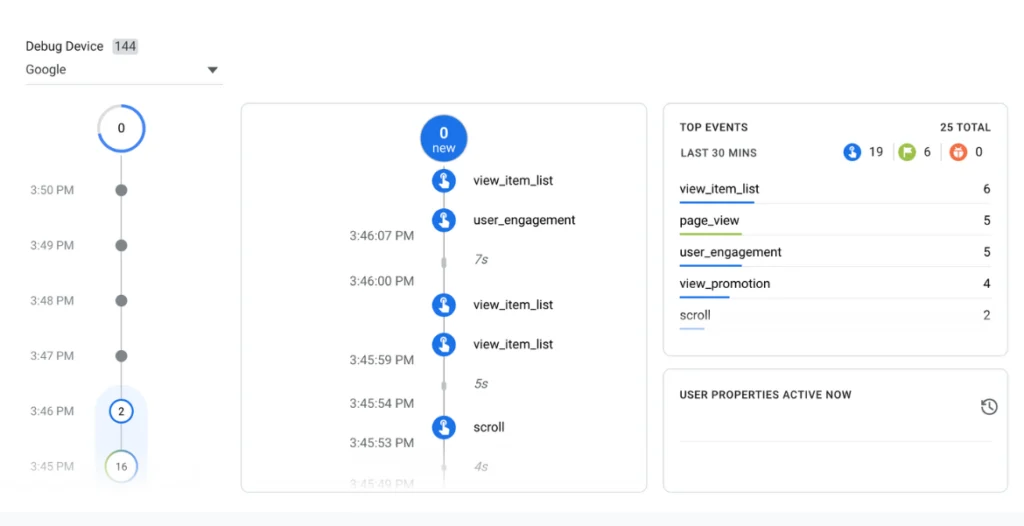
Debug View in GA4 is a specialized mode that shows a live feed of events from a specific device or browser, enabling developers and marketers to troubleshoot and verify if their setup accurately tracks all intended events, especially during the early stages of GA4 setup. Additionally, Debug View allows users to instantly validate the implementation of tracking codes, verify event parameters, and identify potential issues, streamlining the testing and optimization process for a seamless analytics experience.
Discover the power of DebugView in GA4. Start learning now!
Our team guides you through Debug View setup in GA4 for clearer data insights!
Why is Debug View Important in GA4?
Debugging in GA4 is essential because it:
- Helps you ensure accurate data tracking by visualizing user actions in real time.
- Identifies errors in tracking configurations before they impact your analytics data.
- Allows quick verification of events, parameters, and properties sent from your website or app.
Step-by-Step Guide to Activating Debug View in GA4
Enabling Debug View in GA4 is straightforward but requires following specific steps to ensure it operates correctly. Once enabled, Debug View provides real-time validation of your tracking setup, allowing you to verify event tracking, conversion tracking, and data sending to GA4, ensuring data accuracy and confidence in your analytics insights.
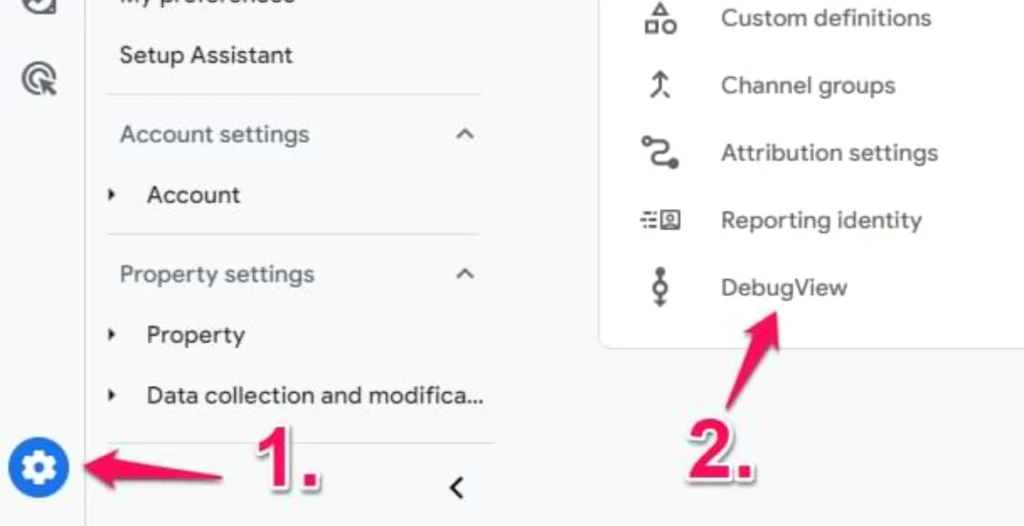
1. Setting Up Debug Mode in GA4
- Navigate to the Google Analytics 4 property needing diagnostic evaluation.
- Go to the bottom left and click on the “Admin” gear icon to open the settings.
- Navigate to “Data Streams” under the “Property” section.
- Select the data stream you want to debug (e.g., iOS, Android, or Web).
- Click on the three vertical dots next to the data stream and select “DebugView”.
- Enable “Debug Mode” by toggling the switch to the right.
- Verify that debug mode is active by checking for the “DebugView” banner at the top of the page.
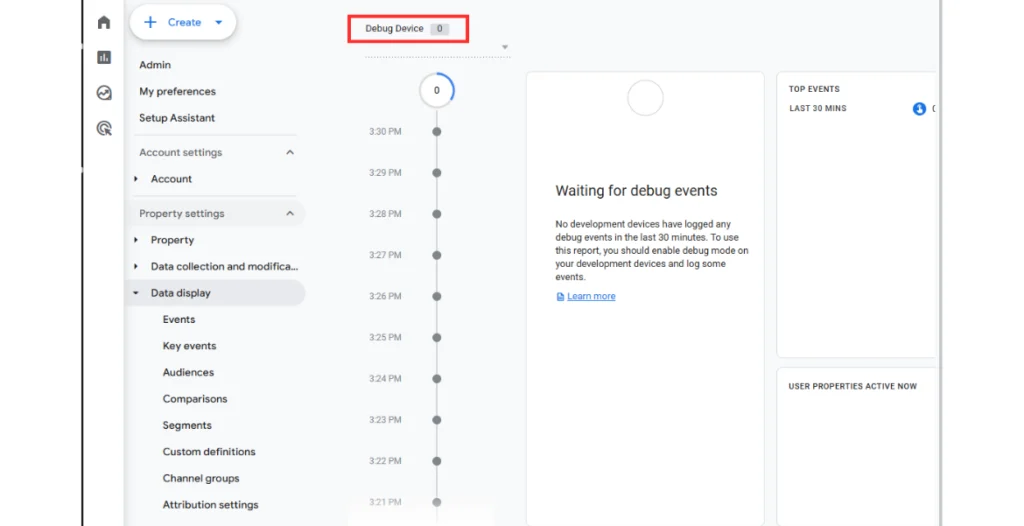
2. Using Google Tag Manager for Debugging
Here are 5 brief steps for using Google Tag Manager (GTM) for debugging:
- Step 1: Enable Debug Mode
In GTM, click the preview button in the top-right corner and enter your website URL to enable debug mode.
- Step 2: Open Debug Console
Navigate to your website and press Ctrl+Shift+D (Windows) or Cmd+Option+D (Mac) to open the debug console.
- Step 3: Verify Tag Firing
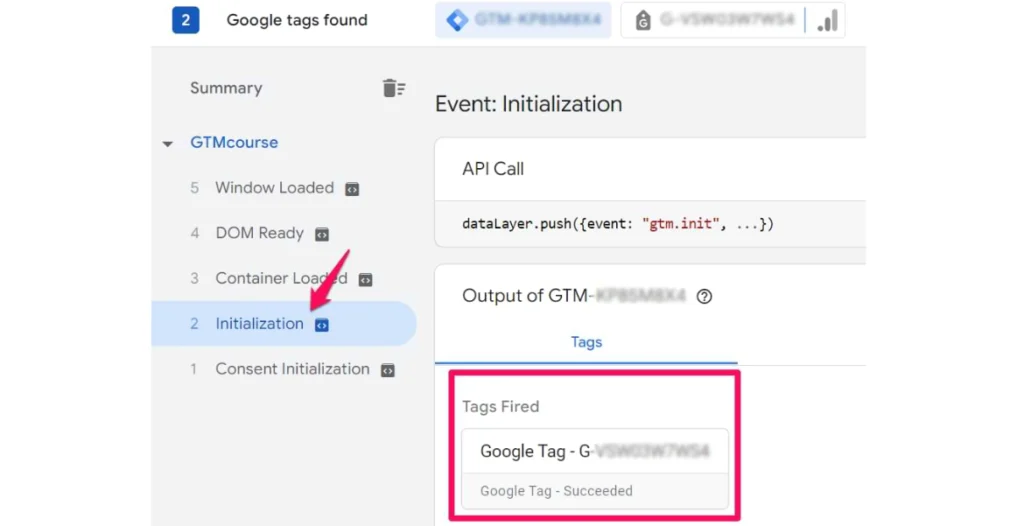
Check the console for tag firing confirmations, looking for “Tags Fired” or “Tags Not Fired” messages.
- Step 4: Inspect Variables
Click on a tag to inspect variables, such as data layers, cookies, or URL parameters.
- Step 5: Test and Refine
Test different scenarios, refine your tags and triggers, and re-debug until desired results are achieved.
Troubleshooting Debug View in GA4
Encountering issues with Debug View not working? Here are some common challenges and solutions to get Debug View back up and running.
Effective Marketing Automation
GA4’s predictive and custom audiences make it easy to automate marketing. By triggering campaigns when users meet certain criteria, you streamline outreach and increase conversion rates.
Common Issues with GA4 Debug View
- Debug View Not Working – This could be due to browser cache, cookies, or an incorrectly configured tag.
- Debug View No Devices Available – If no devices show up, it might be due to insufficient permissions or device settings.
How to Fix GA4 Debug View if It's Not Working?
1. Check Tracking Code Setup
Ensure proper setup of the GA4 tracking code for accurate website analytics. If the code is incomplete or outdated, Debug View won’t function as expected.
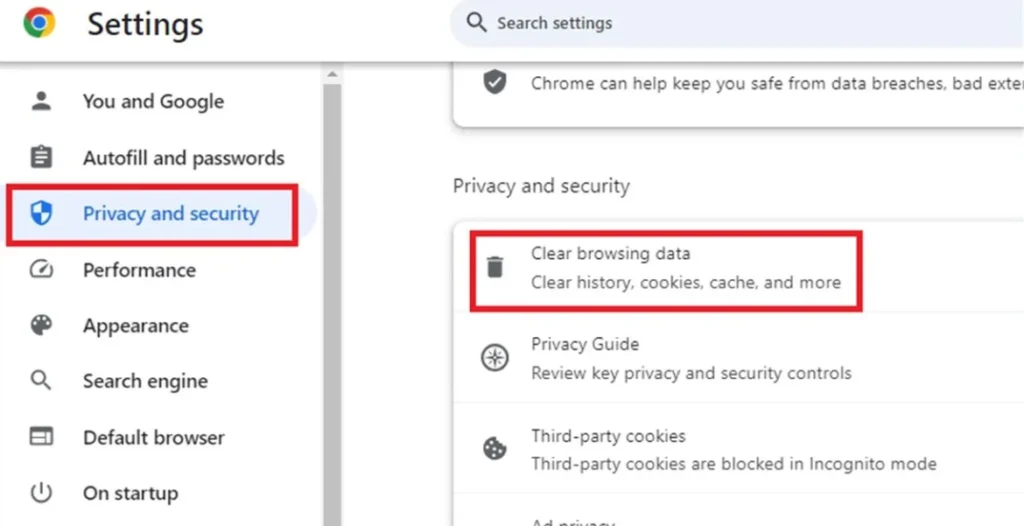
2. Clear Browser Cache and Cookies
Debug View relies on cookies to display real-time data. Clear your browser cache and cookies, then refresh your Debug View to see if it resolves the issue.
3. Ensure Debug Mode is Enabled Correctly
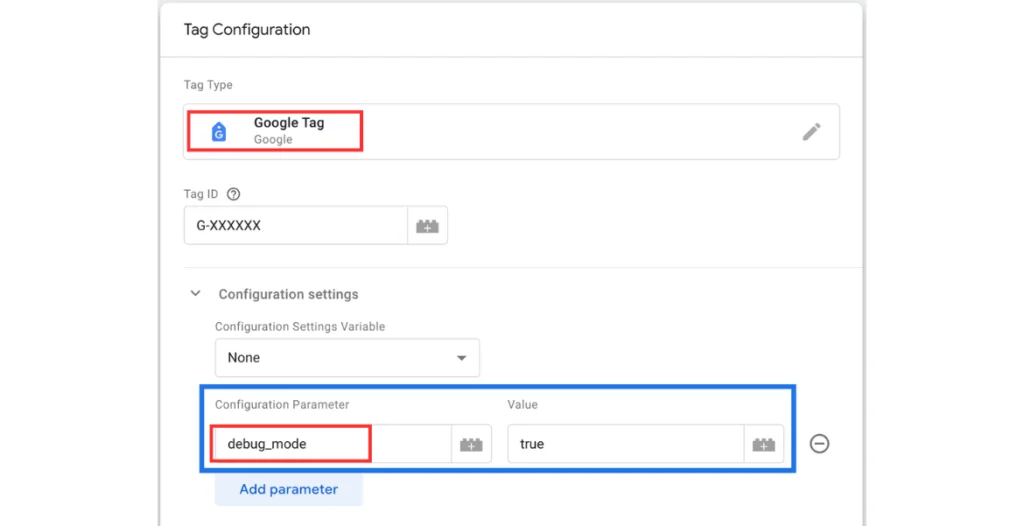
Double-check that your GA4 property has debug_mode enabled in the settings or through Google Tag Manager’s Preview Mode.
Setting Up Debug View via Google Tag Manager
When using Google Tag Manager, you can enable Debug View through Preview Mode:
- Navigate to Tag Assistant in GTM and select Preview.
- Open your website, where Debug View will show active events based on your tag triggers, allowing you to confirm data collection accurately.

Debugging with GA4 Event Tracking
Event tracking is a core feature in GA4, where Debug View shows every event type, parameter, and value. Here’s how to use it effectively:
- View event names, parameters, and user properties directly in Debug View.
- Use the live feed to adjust tracking based on real-time interactions with your site.
Real-Time Data Monitoring in Debug View
Real-time monitoring in Debug View allows you to catch issues as they happen. Make adjustments in your GA4 or GTM setup and see the results live, ensuring accurate data collection. Additionally, this instantaneous feedback loop enables swift troubleshooting and optimization, empowering you to refine your configuration for seamless data analysis and informed decision-making.
Exploring Event Parameters in Debug View
Parameters provide more context to each event. In Debug View:
Select an event to view its parameters, which can help you identify data inconsistencies and troubleshoot specific issues in your analytics setup.
Understanding Device Availability in Debug View
Sometimes, “no devices available” appears in Debug View. This issue could result from user privacy settings, browser restrictions, or device settings. Ensuring that permissions are granted for data sharing can resolve this issue. Additionally, verifying that your device’s developer mode is enabled and that any ad-blocking software is disabled can also help troubleshoot and resolve device availability issues.
Optimizing Debugging with Real-Time Monitoring
Utilizing Debug View with real-time data enables instantaneous verification of changes made to your tracking configuration. Refresh Debug View after any adjustments to confirm data flows correctly. Additionally, this dynamic feedback loop empowers iterative refinement, allowing developers to swiftly identify and resolve issues, streamlining the debugging process.
Additional Tips for Using Debug View in GA4
- Use Different Devices: Test across multiple devices to ensure accurate data tracking across platforms.
- Collaborate with Team Members: Enable Debug View during team reviews to collaboratively check tracking accuracy.
- Document Changes: Note each configuration change in Debug View to ensure consistent debugging results.
Learn to enable DebugView in GA4 and improve tracking now!
Let us enable Debug View in GA4, so you gain full control over tracking!
Conclusion
Enabling and using Debug View in GA4 effectively ensures that your tracking setup is reliable and captures data accurately. By following these steps and troubleshooting common issues, you can maximize your analytics insights and eliminate data tracking errors. For further assistance with GA4 and advanced analytics setups, Go SEO Monkey’s services offer specialized expertise to enhance your tracking and data reliability.
FAQs
- What is Debug View in GA4?
Debug View is a real-time monitoring tool in GA4 that lets you see event data as users interact with your site. - Why is my DebugView not functioning properly in Google Analytics 4?
This may be due to improper setup, browser cache issues, or Debug Mode not being enabled correctly. - Can I enable Debug View using Google Tag Manager?
Yes, GTM’s Preview Mode can activate Debug View, allowing you to monitor events in real-time. - Is Debug View available for all devices?
Debug View is available on supported devices, but browser and device settings can impact availability. - How do I use the Google Analytics Debugger Extension?
The extension is added to Chrome, and once enabled, it logs GA4 events in Debug View for verification.


